Web3 SQL Weekly #7: Cohort Retention for Opensea and Other NFT Marketplaces
Teaching you how to calculating monthly cohort user retention, for every NFT marketplace.
Welcome back! I’ll be breaking down one (community submitted) query a week into byte-sized bits, making both the SQL and Blockchain concepts more digestible.
You can find all the weeks here, and submit/vote on future week queries here.
If you’re a complete beginner, you can reference this guide for any terms that are unfamiliar.
<this week I’m starting to split the videos into two sections, one on the blockchain concepts and one on the SQL query. Find them below!>
What:
Last week, I shared a chart showing Opensea’s Seaport monthly wallet retention by cohort. This is measuring for each batch of new wallets a month, how many months in a row do they come back and interact at least once with the contract.
However, this runs into the issue that Opensea has already deployed multiple contracts before. So the first month on the Seaport 1.1 contract contains a lot of already really sticky users (hence the much higher retention).
Let’s dive deeper to create a more accurate analysis, that can be generalized to all NFT marketplaces on any chain.
Blockchain concepts:
First, let’s cover how we’re measuring interactions. For the example in my tweet, I’m using the same methodology we used in this weekly query, which looks at traces (internal calls) that include direct and indirect transactions. However we’ll soon see that in this case, we’re missing something if we do that.
We’re measuring for all wallets that interact with an Opensea listing (ever). So even if someone used Blur to buy, as long as the listing was filled on Opensea then that’s still an Opensea user. There are a few ways of finding all contract addresses for a project:
check for all contracts from the same deployer using ethereum.creation_traces.
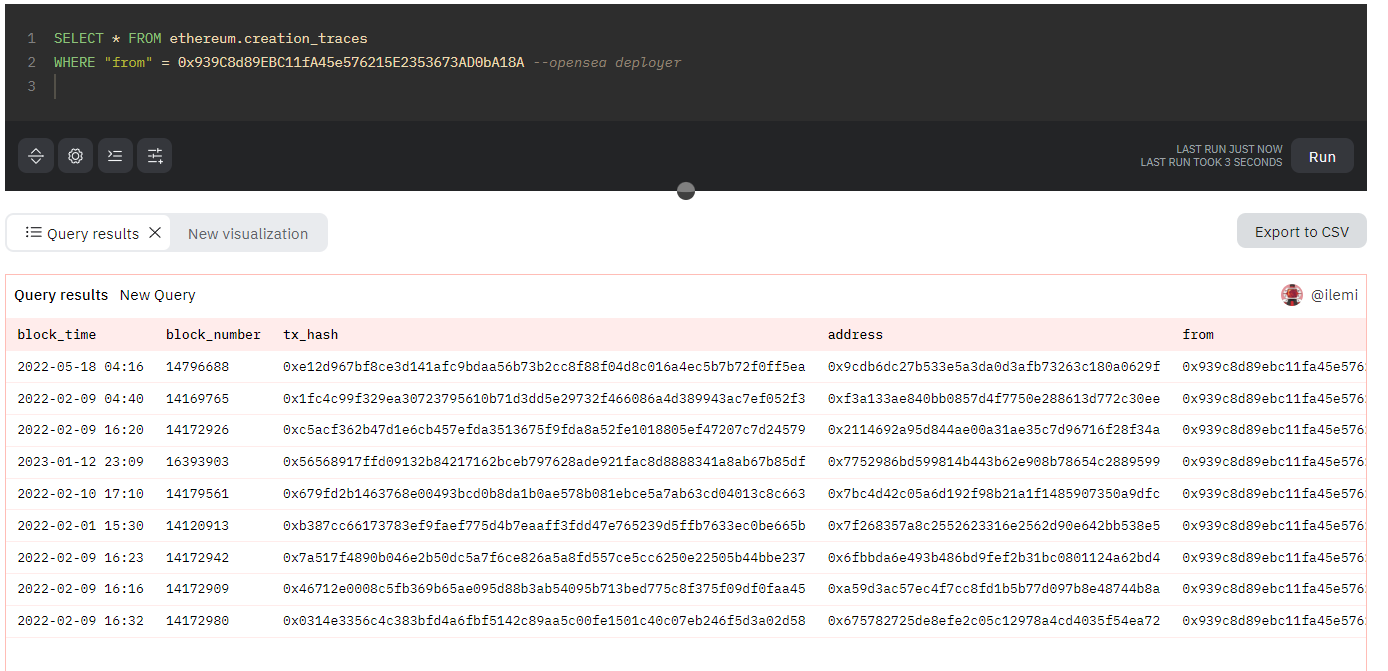
we’re taking the deployer of seaport 1.1 and checking it against all deployed contracts, finding 9 of them. check namespace from ethereum.contracts
check docs or repo and hope/pray 🙏 Get ready to have an excel sheet open for you to cross reference everything.
Even still there will be nuances, such as Seaport being an open protocol such that you want to use the Opensea Conduit (marketplace contract that listings are “assigned” to) and not the seaport contract itself.
Skrrrt… but wait, there’s more
When you make a bid or offer on Opensea, that first action happens off chain with just a signature. So when the order is filled, we only really see the address who filled it (that’s the transaction from). This means we’re missing the wallet address that made the bid/offer every time an order is filled - so we can’t use the naive traces method for this!
To get around this, we’ll be using the nft.trades table instead to get more accurate results, because that table tracks the buyer AND the seller wallet address.
This table still tracks the project namespace in the project column, so we can just filter for “opensea” or any other NFT marketplace there.
Let’s (finally) get into the query.
SQL Query Walkthrough:
Here’s the query we’re going to create today. If the pace below is too fast, check out the video above where I explain everything line by line!
So first, let’s take the UNION ALL and then DISTINCT of month and user address of “buyer” and “seller” from nft.trades, where the project is “opensea” and the blockchain is “ethereum” (in parameters). This gives us all the months every wallet address was active.
Next, we assign each user to a cohort by first month they were active, and get the total size of each cohort, and get the total addresses active from each cohort for a given month with this simple join and group by. We do a row_number() in the last CTE because we just want the “month_1”, “month_2”, “month_3” after the cohort starts and not the actual dates.
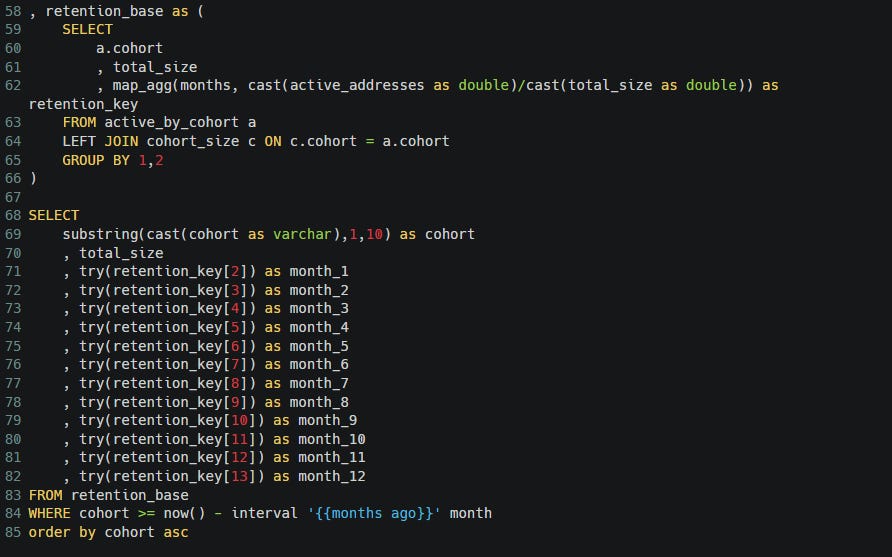
For the last part here, we need to pivot the table such that each row is a cohort and each column is a month, and the cell value is the retention rate. There are a few ways of going about this, the way I use is using map_agg() to create a dictionary of month to retention rate, and then making each month its own column. Some cohorts won’t have had a month 2,3,4,etc, so I use the try() function to return null so we don’t get an “out of index” error.
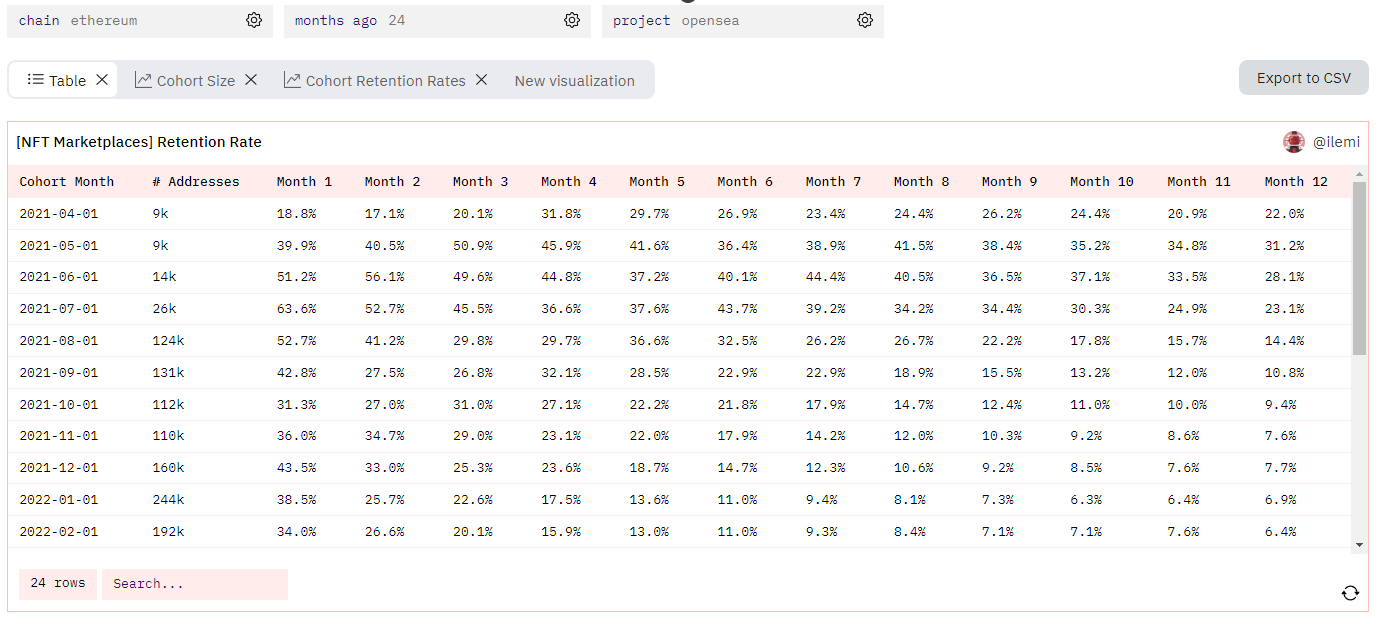
With that the query is done, and we get this clean table (after some formatting):
Which we can then use to plot the 1, 5, and 10 month retentions for each cohort. The way to read this is that the 2021-04-01 cohort had a 20% month 1 retention, a 30% month 5 retention, and a 25% month 10 retention:
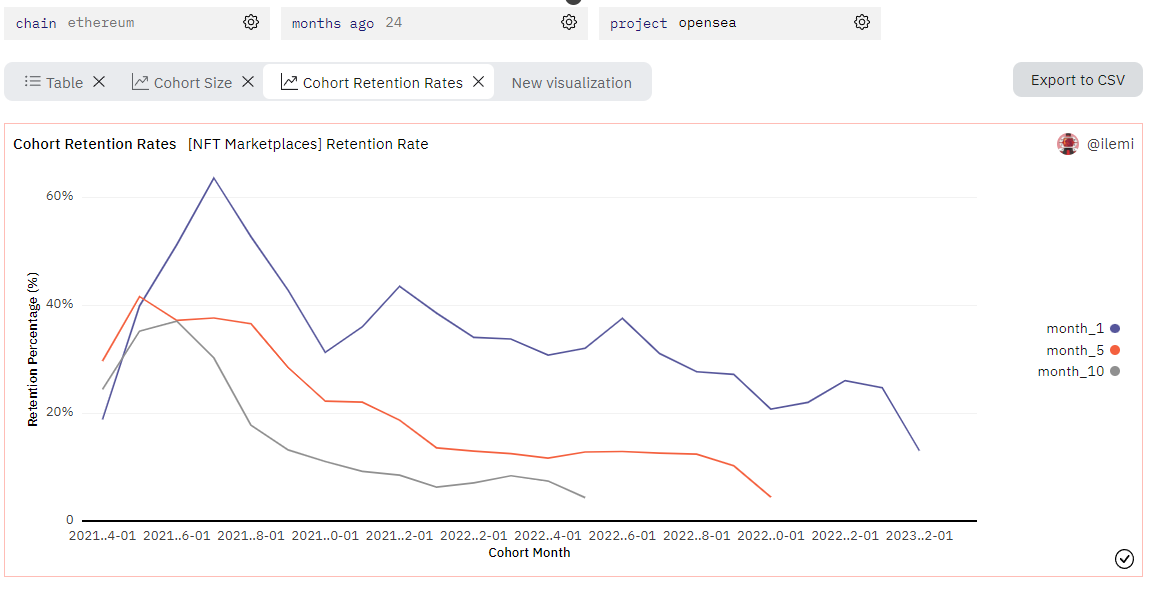
Since September of 2021, retention rates have been pretty steady for Opensea for the last 20 or so cohorts.
1 month retention is around 35%
5 month retention is around 12.5%
10 month retention is around 9%
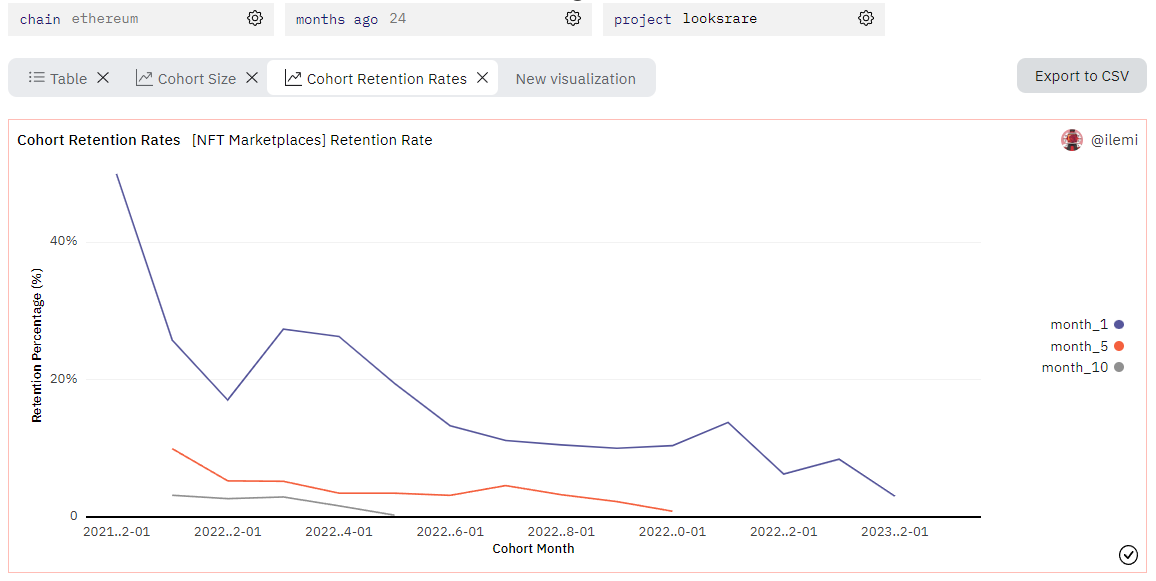
If you want to see some crazier curves, try looking at a protocol that used farming/token incentives over time. For example, LooksRare below has plummeted to close to 3% retention rate for 1,5, and 10 months - so you can see that their growth was unsustainable.
Bonus question:
Try and apply what you’ve learned to another protocol, like Uniswap or Balancer. Instead of nft.trades, what table should you use? Do this analysis and tag me on Twitter at andrewhong5297!
Hope you learned something! Don’t forget you can submit/vote on future week queries here.


