

Day 12 (12 Days of Dune): Clustering all USDC Uniswap v2 pairs based on liquidity stability
We find some really interesting insights as we use the volatility, concentration, liquidity, price impact, and reserves to analyze all USDC pairs.

We’ll be answering questions and covering more beginner-focused concepts during office hours at 2pm EST, so join us in the #12-days-of-dune discord channel. You’ll need to earn the course NFT and connect to the Dune guild.
Welcome to day 12!
CONGRATS on making it through the whole program! It wasn’t easy, so big props to you for sticking it out. If you’ve attempted and/or solved each query, I guarantee that you already know more than 99% of other web3 analysts out there.
We’ve had a lot of fun teaching you, and hope you had a great time too.

There’s going to be a competition that’s open for submission until 1/8/2023 with details at the end of the post - there’s 3000 USDC in prizes and also NFTs you can earn that will give you special access to programs and opportunities in the future.
Here’s the final video walkthrough:
Most of the generalization was simple, we only introduced one new concept:
We took the standard deviations and magnitude from query 11, the price impact from query 10 (but made sure USDC was also token 0 so we can simulate correctly), and took the percent/total reserves from query 9. All of these nicely come out to one value per pair - so nothing much we need to do for these ones.
However, liquidity concentration from query 8 showed all the holders and their LP tokens held as a percent of total LP token supply. We need to reduce this to one metric to make comparison across pairs easier - so I decided to use the Herfindahl-Hirschman Index. This is a common metric used in economics to proxy the competitiveness of an industry. The maximum value is 10000, where one firm owns 100% of the industry (100*100 = 10000). Anything under 2500 is considered somewhat fair.

To calculate the formula, we implemented a lambda function across all the columns using the reduce_agg() function. It wasn’t strictly necessary in our case, but is helpful for more complex formulas you might need in the future!
....
, reduce_agg(balance/ts.total_balance*100 --holder balance
                , 0 --starting sum at 0
                , (s, x) -> s + pow(x,2) --square each row
                , (row_0, row_1) -> row_0 + row_1) --add each row together
                as hhi
....

Altogether, we found the below results over a 10 month period. The query is on Dune here, and the dashboard is here.

You can see that as you move right along the table, there’s more and more variation in the data! Let’s walk through the charts and how I interpreted them.
First, USDC/WETH has the most number of holders and the lowest HHI. This makes sense, and I would have expected a fairly linear relationship between number of holders and HHI. However, we can see for some pairs like USDC/DAI (big orange circle on the top right) there are almost 300 holders but the HHI is still 9000 - meaning the liquidity is highly concentrated.

Now that we understand concentration, we can compare HHI to magnitude (volatility of liquidity). I had also expected a linear relationship here, where the higher the HHI the higher the magnitude - but it seems most magnitudes are concentrated around 1x-50x. USDC/DAI sits at 100x, which is fairly high.

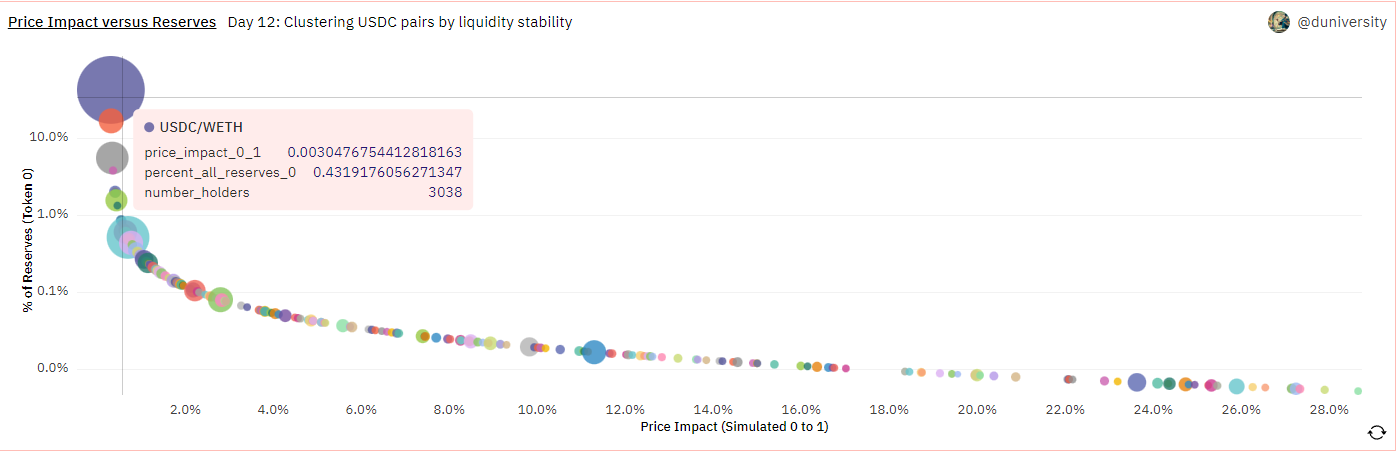
Next, let’s look at price impacts. As we might expect, the higher the reserves you have the smaller the price impact of a 2000 USDC trade. Both USDC/WETH and USDC/DAI have a price impact of roughly 0.3%! So just because there is more volatility and concentration in USDC/DAI, doesn’t mean it’s inherently a worse pair. But in the case of a DAI depeg or high risk event - the liquidity could disappear very quickly!
Looking at reserves of token 0 and 1 as a percent of all token 0 and 1 reserves (across pairs), we can see that most pairs have all of their token 1 liquidity in this pair. Remember that token 0 is always USDC in this case, because we did a CASE WHEN. You might notice that the pairs with lower token 0 reserve % (i.e. 30% or lower), are also the ones with lower the price impact and concentrations in the last few charts. Maybe there is something there to further explore!

And with that - our liquidity stability analysis is over! We’ve now holistically covered DEXs from all sides. There’s plenty deeper you can go on each metric here, and we would love to see that work from you. :)
Let’s talk about the competition:
We’ll be hosting a competition with the Uniswap Foundation (who have sponsored a portion of the bounty)! They’ve hosted many competitions already covering all sorts of interesting DEX topics.

All the details and the submission link are at the bottom of the notion doc here! There is 3000 USDC in prizes, and all submitters will get a participation NFT that will give them access to special programs and channels in the future. Winners will get a Wizards NFT!
There will be a channel for discussing the competition in the Dune discord (you’ll need the 101.xyz NFT to join in) - we’ll be helping students out in there. Hope to see you around!